

Assignment: Data Analysis Essay
Assignment Data Analysis Essay
- State your results for the sample: the mean, median, mode, range, variance, and standard deviation
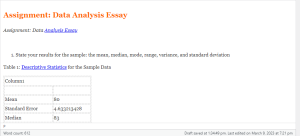
Table 1: Descriptive Statistics for the Sample Data
| Column1 | |
| Mean | 80 |
| Standard Error | 4.633213428 |
| Median | 83 |
| Mode | 83 |
| Standard Deviation | 14.65150732 |
| Sample Variance | 214.6666667 |
| Kurtosis | 0.694854765 |
| Skewness | -1.237868949 |
| Range | 45 |
| Minimum | 50 |
| Maximum | 95 |
| Sum | 800 |
| Count | 10 |
Table 1 above indicates the descriptive statistics for the dataset shown. The mean, median, mode, range, variance, and standard deviation are represented in the table as 80, 83, 83, 45, 214.6666667, and 14.65150732, respectively. The result indicates measures of
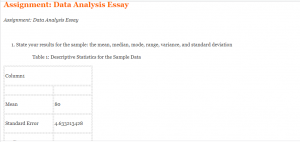
central tendency which summarize statistics representing the center points or typical values within the dataset. The above measures show where most values fall within the distribution. They also depict central locations of the dispersal. From the dataset, there is the tendency of the data to gather or cluster around the middle value (Jarman, 2013). In the statistical analysis, the common measures of central tendency include median, mean, and mode as indicated in table 1. The measures determine the locations of the central points by the use of different methods.
Click here to ORDER an A++ paper from our MASTERS and DOCTORATE WRITERS: Assignment: Data Analysis Essay
The best method for the analysis of the data is the use of the Microsoft Excel Analysis Toolpak add-in. The above tool enhances data analysis processes as well as other important calculations. The tool, however, does not default within the Excel; it is usually activated manually from the tile tab within the options section. Excel Toolpak add-in facilitates the analysis processes including the descriptive statistics as well as other statistical tests. From the dataset given, using Toolpak add-in enhances the accuracy of the results. The given data had a normal distribution; it was easier to apply excel to compute descriptive statistics and the general measures of the central tendencies. Also, because the sample size is small it is possible to use the formulas to conduct calculations; however, this may not be accurate due to errors that may be encountered. The use of Microsoft Excel, therefore, provides much easier way of determining the descriptive statistics with much accuracy.
One-Sample t-test
| Table 2: One-Sample Test | ||||||
| Test Value = 70 | ||||||
| t | df | Sig. (2-tailed) | Mean Difference | 95% Confidence Interval of the Difference | ||
| Lower | Upper | |||||
| students score | 2.158 | 9 | .059 | 10.000 | -.48 | 20.48 |
Table 2 above indicates one-sample t-test for the data. From the result, the significant value is 0.59, which is greater than 0.05, we, therefore, fail to reject the null hypothesis and conclude that the mean of the sample data is not different from the population mean of 70. Also, from the table, the t-value is 2.158, and the mean difference is 10. The 95% confidence interval of the mean difference is (-0.48, 20.48).
The result obtained would be useful in the interpretation of the scores. Also, the information would be useful in exploring data in meaningful ways. Through the expression of facts as given in the results, one can gain or make meaningful conclusions from the dataset. Data analysis interprets, organizes, structures and presents information into useful information that gives contexts for the data (Guerrero, 2010). A t-test, therefore, is used for two independent variables presented, that is, having Employ Status being categorical and having two categories and Fitness Hour measured in ratio level. Data analysis results can be used in the decision-making processes and to enhance policy-making.
Given the following students\’ test scores (95, 92, 90, 90, 83, 83, 83, 74, 60, and 50), identify the mean, median, mode, range, variance, and standard deviation for the sample.
Write a 500-750 word summary and analysis discussing the results of your calculations.
1. State your results for the sample: the mean, median, mode, range, variance, and standard deviation
2. Explain which method is best for this data set. Why?
3. Conduct a one-sample t-test and interpret the results (use a population mean of 70).
4. In what situations would this information be useful?
Lopes Write Policy
For assignments that need to be submitted to Lopes Write, please be sure you have received your report and Similarity Index (SI) percentage BEFORE you do a “final submit” to me.
Once you have received your report, please review it. This report will show you grammatical, punctuation, and spelling errors that can easily be fixed. Take the extra few minutes to review instead of getting counted off for these mistakes.
Review your similarities. Did you forget to cite something? Did you not paraphrase well enough? Is your paper made up of someone else’s thoughts more than your own?
Visit the Writing Center in the Student Success Center, under the Resources tab in LoudCloud for tips on improving your paper and SI score.
Late Policy
The university’s policy on late assignments is 10% penalty PER DAY LATE. This also applies to late DQ replies.
Please communicate with me if you anticipate having to submit an assignment late. I am happy to be flexible, with advance notice. We may be able to work out an extension based on extenuating circumstances.
If you do not communicate with me before submitting an assignment late, the GCU late policy will be in effect.
I do not accept assignments that are two or more weeks late unless we have worked out an extension.
As per policy, no assignments are accepted after the last day of class. Any assignment submitted after midnight on the last day of class will not be accepted for grading.
Communication
Communication is so very important. There are multiple ways to communicate with me:
Questions to Instructor Forum: This is a great place to ask course content or assignment questions. If you have a question, there is a good chance one of your peers does as well. This is a public forum for the class.
Individual Forum: This is a private forum to ask me questions or send me messages. This will be checked at least once every 24 hours.
Important information for writing discussion questions and participation
Welcome to class
Hello class and welcome to the class and I will be your instructor for this course. This is a -week course and requires a lot of time commitment, organization, and a high level of dedication. Please use the class syllabus to guide you through all the assignments required for the course. I have also attached the classroom policies to this announcement to know your expectations for this course. Please review this document carefully and ask me any questions if you do. You could email me at any time or send me a message via the “message” icon in halo if you need to contact me. I check my email regularly, so you should get a response within 24 hours. If you have not heard from me within 24 hours and need to contact me urgently, please send a follow up text to
I strongly encourage that you do not wait until the very last minute to complete your assignments. Your assignments in weeks 4 and 5 require early planning as you would need to present a teaching plan and interview a community health provider. I advise you look at the requirements for these assignments at the beginning of the course and plan accordingly. I have posted the YouTube link that explains all the class assignments in detail. It is required that you watch this 32-minute video as the assignments from week 3 through 5 require that you follow the instructions to the letter to succeed. Failure to complete these assignments according to instructions might lead to a zero. After watching the video, please schedule a one-on-one with me to discuss your topic for your project by the second week of class. Use this link to schedule a 15-minute session. Please, call me at the time of your appointment on my number. Please note that I will NOT call you.
Please, be advised I do NOT accept any assignments by email. If you are having technical issues with uploading an assignment, contact the technical department and inform me of the issue. If you have any issues that would prevent you from getting your assignments to me by the deadline, please inform me to request a possible extension. Note that working fulltime or overtime is no excuse for late assignments. There is a 5%-point deduction for every day your assignment is late. This only applies to approved extensions. Late assignments will not be accepted.
If you think you would be needing accommodations due to any reasons, please contact the appropriate department to request accommodations.
Plagiarism is highly prohibited. Please ensure you are citing your sources correctly using APA 7th edition. All assignments including discussion posts should be formatted in APA with the appropriate spacing, font, margin, and indents. Any papers not well formatted would be returned back to you, hence, I advise you review APA formatting style. I have attached a sample paper in APA format and will also post sample discussion responses in subsequent announcements.
Your initial discussion post should be a minimum of 200 words and response posts should be a minimum of 150 words. Be advised that I grade based on quality and not necessarily the number of words you post. A minimum of TWO references should be used for your initial post. For your response post, you do not need references as personal experiences would count as response posts. If you however cite anything from the literature for your response post, it is required that you cite your reference. You should include a minimum of THREE references for papers in this course. Please note that references should be no more than 5 years old except recommended as a resource for the class. Furthermore, for each discussion board question, you need ONE initial substantive response and TWO substantive responses to either your classmates or your instructor for a total of THREE responses. There are TWO discussion questions each week, hence, you need a total minimum of SIX discussion posts for each week. I usually post a discussion question each week. You could also respond to these as it would count towards your required SIX discussion posts for the week.
I understand this is a lot of information to cover in 5 weeks, however, the Bible says in Philippians 4:13 that we can do all things through Christ that strengthens us. Even in times like this, we are encouraged by God’s word that we have that ability in us to succeed with His strength. I pray that each and every one of you receives strength for this course and life generally as we navigate through this pandemic that is shaking our world today. Relax and enjoy the course!
Hi Class,
Please read through the following information on writing a Discussion question response and participation posts.
Contact me if you have any questions.
Important information on Writing a Discussion Question
- Your response needs to be a minimum of 150 words (not including your list of references)
- There needs to be at least TWO references with ONE being a peer reviewed professional journal article.
- Include in-text citations in your response
- Do not include quotes—instead summarize and paraphrase the information
- Follow APA-7th edition
- Points will be deducted if the above is not followed
Participation –replies to your classmates or instructor
- A minimum of 6 responses per week, on at least 3 days of the week.
- Each response needs at least ONE reference with citations—best if it is a peer reviewed journal article
- Each response needs to be at least 75 words in length (does not include your list of references)
- Responses need to be substantive by bringing information to the discussion or further enhance the discussion. Responses of “I agree” or “great post” does not count for the word count.
- Follow APA 7th edition
- Points will be deducted if the above is not followed
- Remember to use and follow APA-7th edition for all weekly assignments, discussion questions, and participation points.
- Here are some helpful links
- Student paper example
- Citing Sources
- The Writing Center is a great resource